

Gartner projects that end-user spending on information security in India will reach about $3.4 billion in 2026, an increase of 11.7% over 2025. Security software accounts for roughly $1.56 billion of that, and managed security services is the fastest-growing subsegment at 15.1%. Gartner's own analysts attached a warning to the forecast: attackers using generative AI could blunt the value of these investments by moving faster than traditional detection and response, and spend should be directed at the most significant gaps rather than spread evenly. The global figure tells the same story at larger scale, with Gartner placing worldwide information security spending at nearly $250 billion for 2026, raised in its June 2026 update.
Money at that volume invites a question that product inventories cannot answer. A board, a CFO, or an auditor reviewing the budget will eventually ask what the spend bought, and a list of deployed tools is a statement about ownership, not about effectiveness. The 2026 Blue Report from Picus Security, published on 11 August and built on more than 338 million attack simulations run in production environments between January and June, shows how wide that gap can be. Controls in the dataset prevented 69% of simulated attacker actions, and 58% of all simulated actions were logged in a SIEM, yet only 14% produced an alert. Once an attacker was already operating as an authenticated user inside the network, prevention fell to 37%.
One caution applies to those figures. They come from a breach and attack simulation vendor's customer base, which likely skews toward organizations that already take validation seriously, so the average enterprise may look worse rather than better. The pattern still matters more than the exact percentages: owning a control, logging its activity, and having it stop an attack are three different outcomes, and most organizations have no measurement showing which of the three they are getting.
Breach and attack simulation, usually shortened to BAS, exists to produce that measurement. It runs safe, repeatable versions of real attacker techniques against live controls and records whether each one was blocked, logged, or alerted on. This guide covers what BAS is and how it differs from vulnerability assessment, penetration testing, and red teaming, why the gap between owning and proving a control keeps widening, where BAS fits inside exposure management, how an engagement runs from scoping to a verified fix, what a report needs to contain to count as evidence, and how to build a programme that survives a budget review. It is written for CISOs, security leaders, and the finance and audit stakeholders who have to defend or challenge the numbers.
Talk to Our Security Experts →
What Breach and Attack Simulation Is
BAS is a form of automated security testing that executes attacker techniques against the controls an organization already runs, endpoint detection, firewalls, web application firewalls, email and web gateways, identity protections, and the SIEM rules sitting behind them. Each simulated technique has an expected result. The control should block it, the telemetry should record it, or an alert should reach an analyst. BAS measures what actually happened and reports the difference.
Three properties separate it from the testing methods around it. It is automated, so the same scenario can run weekly or daily rather than once a year. It is repeatable, so a result before a configuration change can be compared directly with a result after. And it is designed to run safely against production or production-like environments without damaging them, which is what makes continuous use practical.
BAS and Neighboring Testing Methods
| Method | Question it answers | Typical cadence | Who executes | Primary output |
|---|---|---|---|---|
| Vulnerability assessment | Which weaknesses exist across systems? | Monthly to continuous | Scanners validated by analysts | A prioritized list of weaknesses |
| Penetration testing | Can a skilled tester exploit those weaknesses and chain them together? | Annual or release-triggered | Human testers | Exploited findings with business impact |
| Red teaming | Would people, process, and tooling stop a real adversary pursuing a goal? | Annual or less often | Human operators | An attack-path narrative and detection scorecard |
| Breach and attack simulation | Do the deployed controls block, log, and alert on known attacker techniques right now? | Weekly to continuous | Automated platform with analyst oversight | Control-by-control effectiveness scores that can be trended |
None of these replaces the others. A penetration test finds the creative path a scanner would miss, and a red team tests judgment under pressure. BAS covers the ground in between, the large, repetitive question of whether every control keeps doing the job it was bought to do.
The Gap Between Owning a Control and Proving It Works
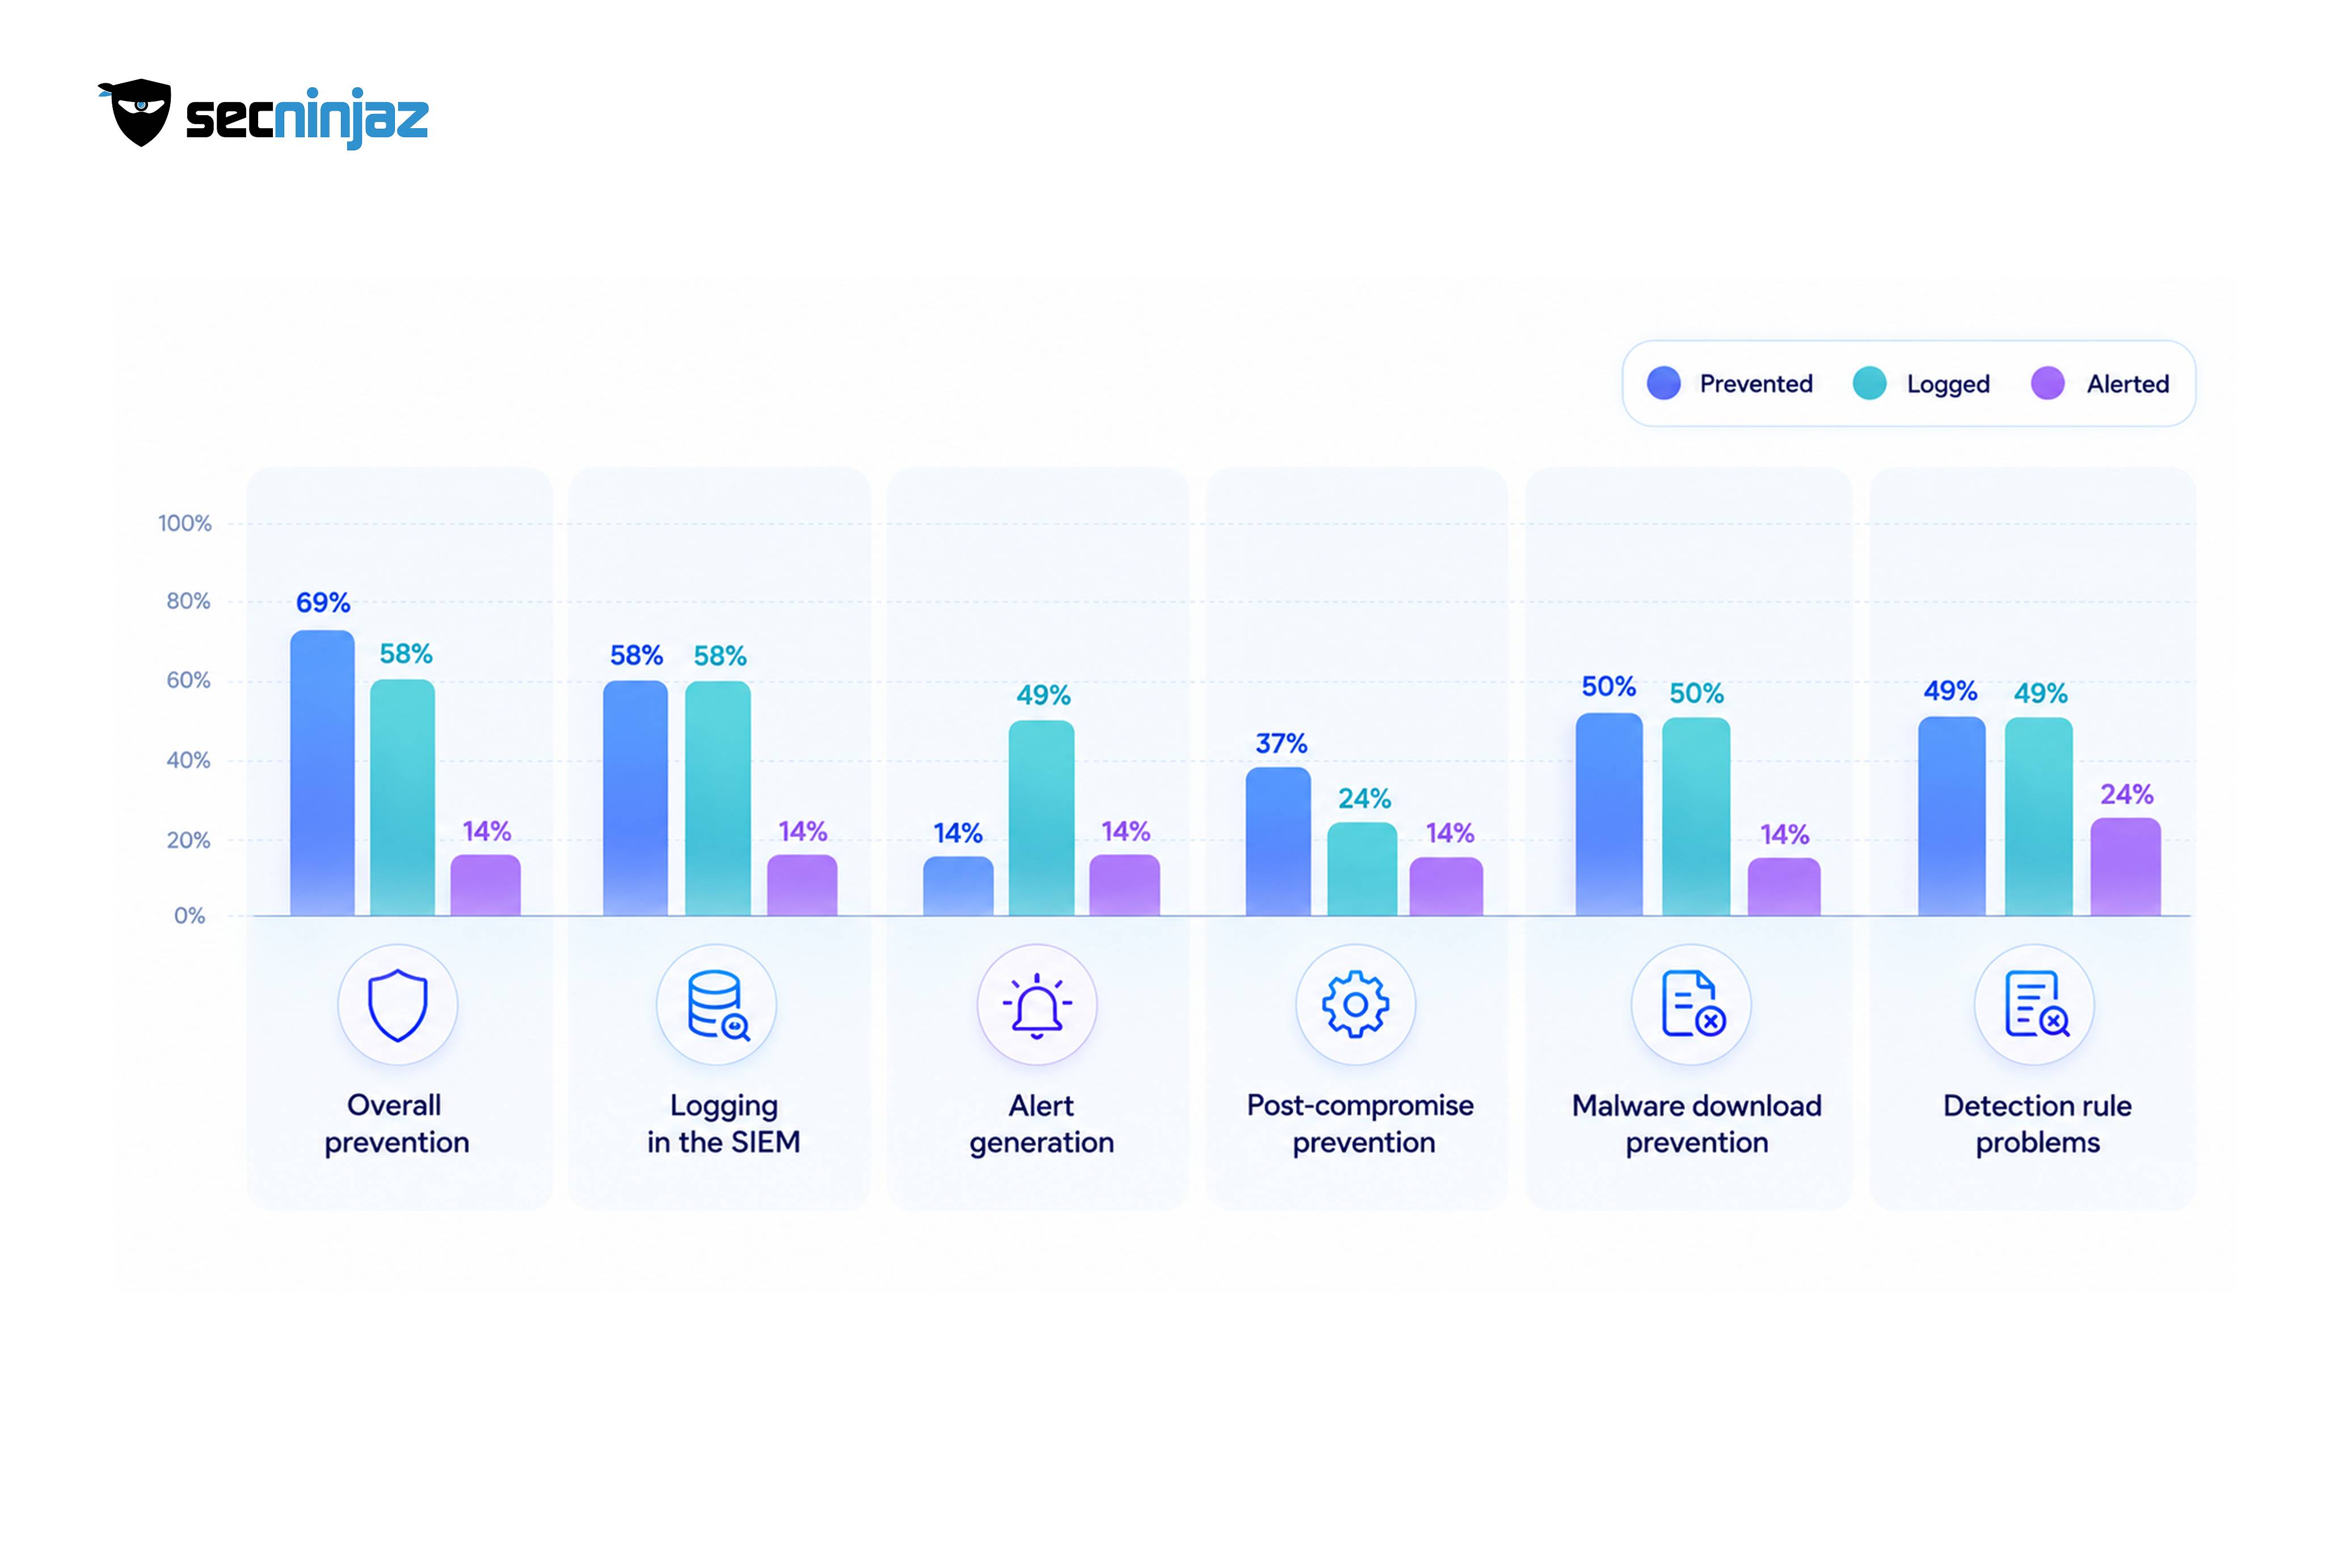
The Blue Report separates what controls do into layers, and the layers rarely agree with each other.
| Layer measured | Reported result | What it indicates |
|---|---|---|
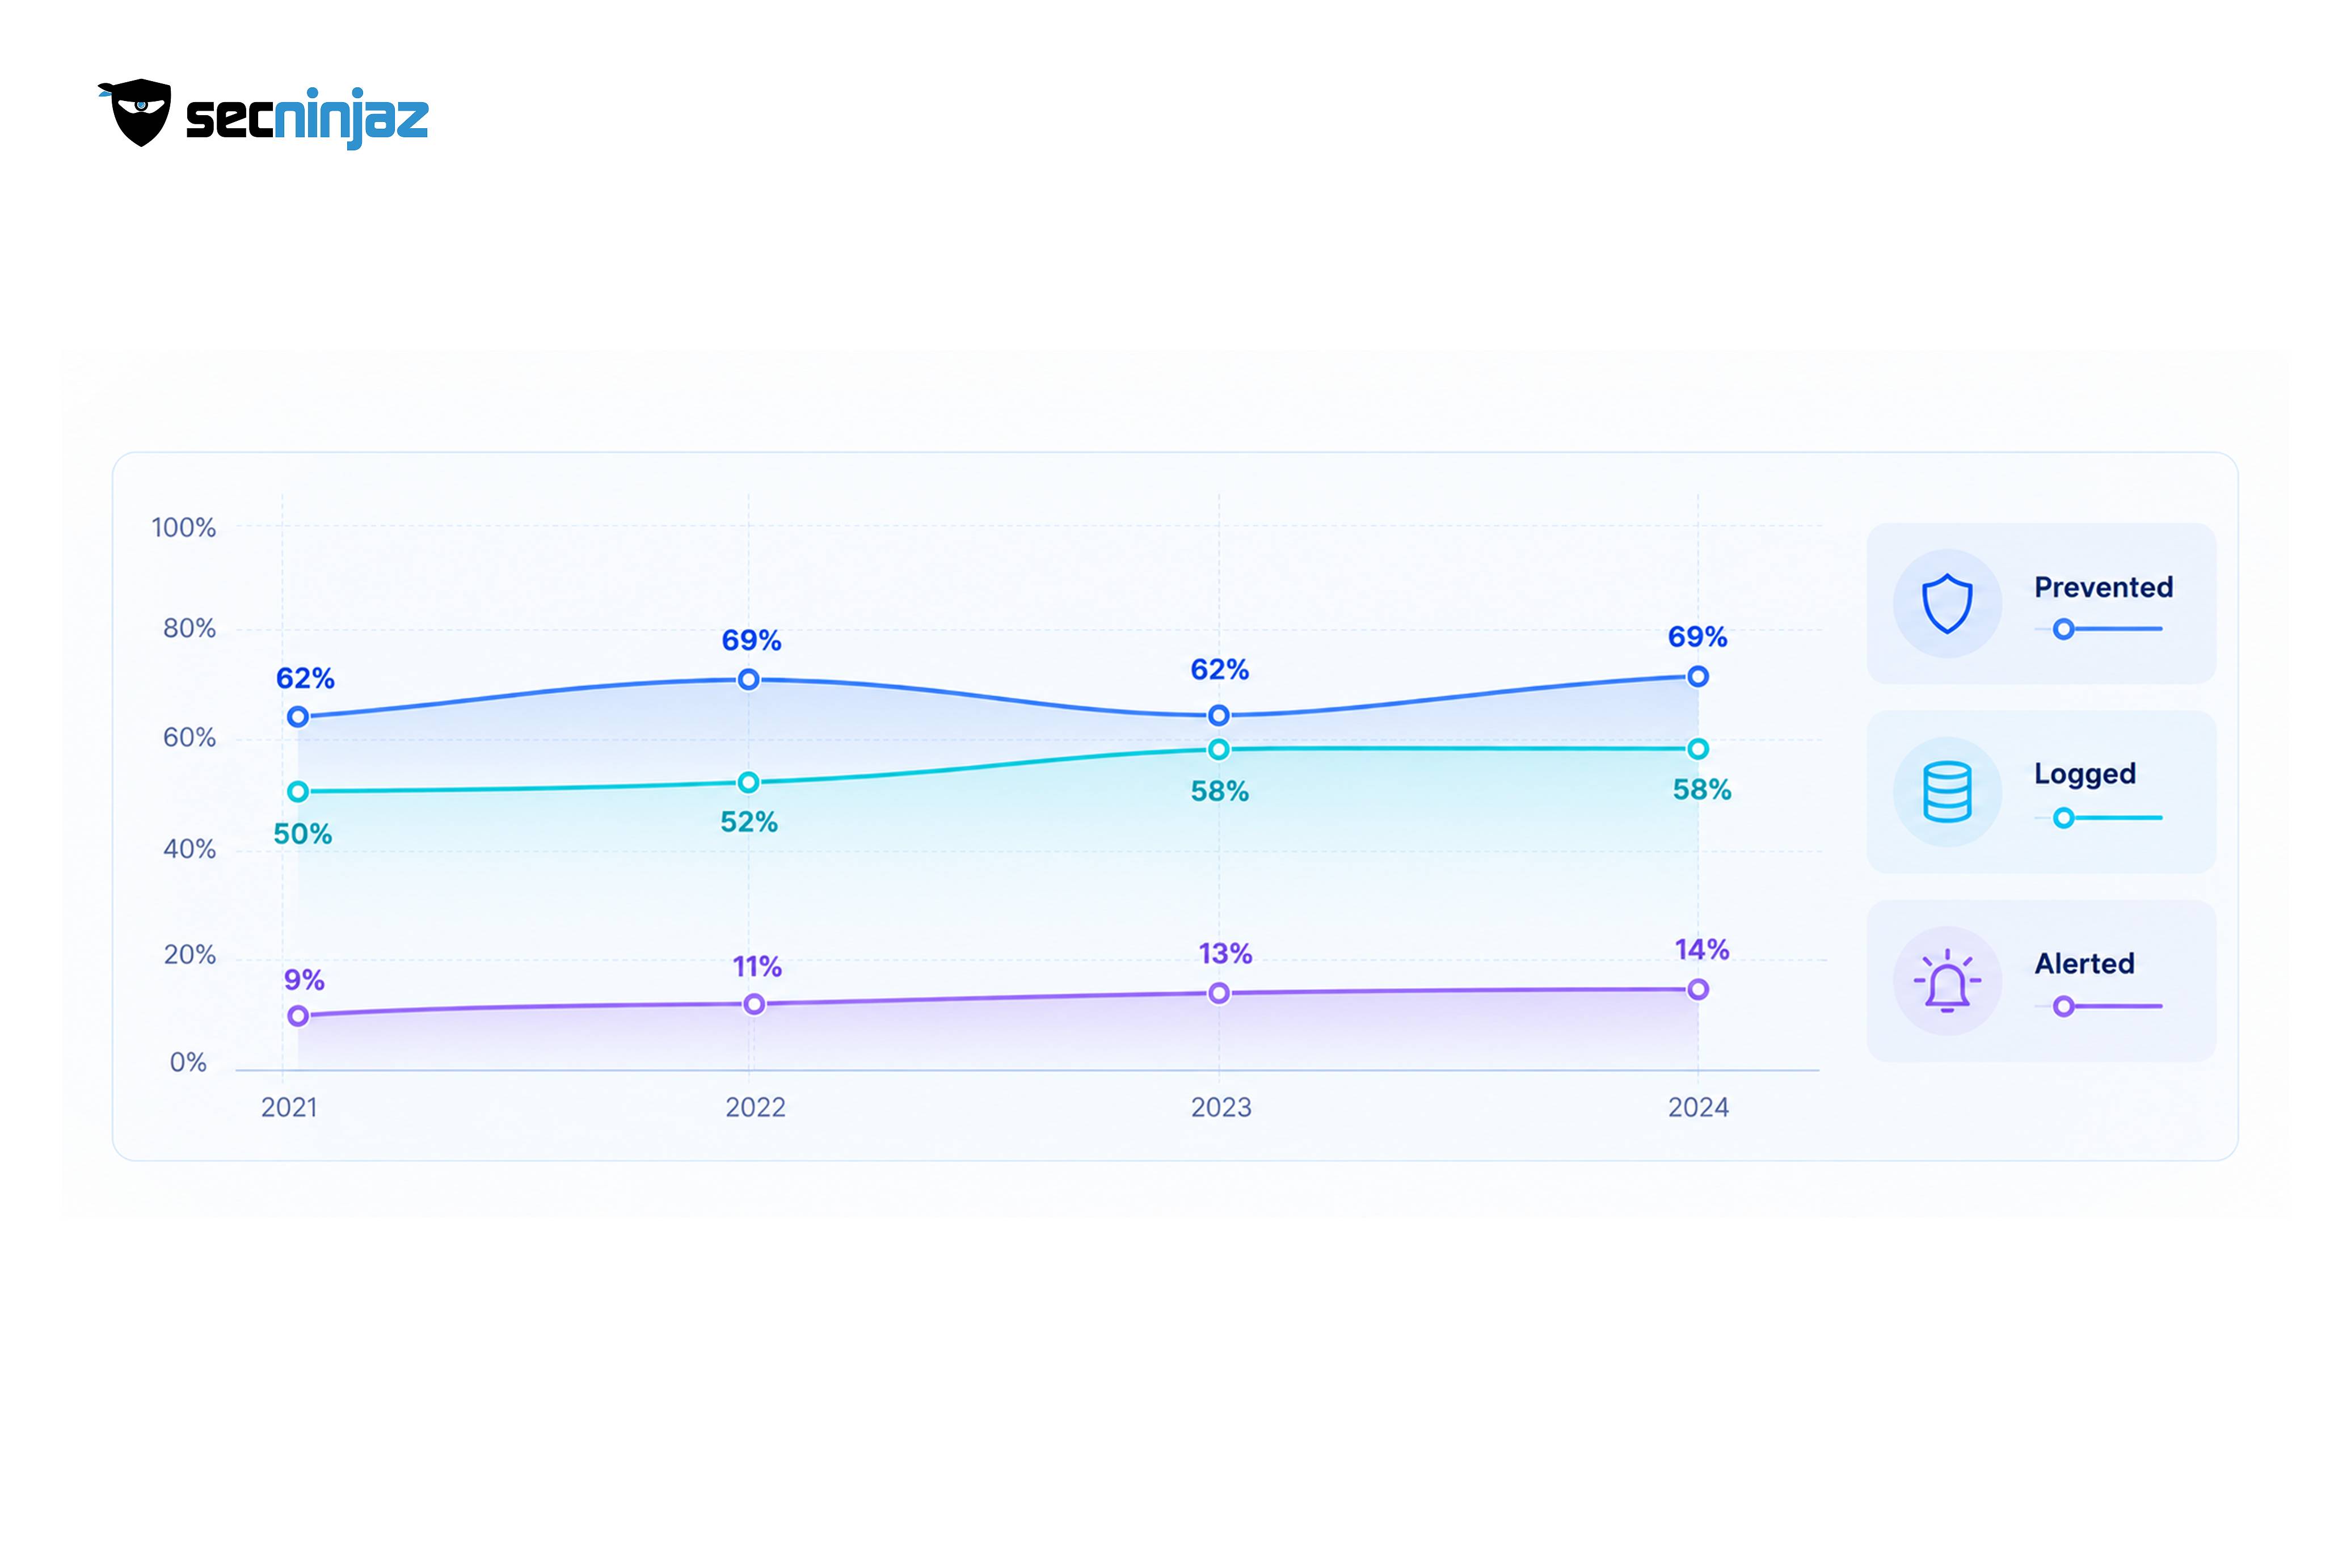
| Overall prevention | 69%, up from 62% the previous year and level with 2024 | Roughly a third of simulated attacker actions still got through |
| Logging in the SIEM | 58%, a four-year high | Telemetry improved, but recording an event is not the same as acting on it |
| Alert generation | 14% | 86% of simulated activity never produced an alert |
| Post-compromise prevention | 37% | Defenses hold better at the edge than once an attacker is inside |
| Malware download prevention | 50%, down from 60% a year earlier and 71% in 2024 | Signature-style blocking of known-bad files is losing ground |
| Detection rule problems traced to performance | 49% of identified issues, up from 24% | Rules that exist on paper are failing under real data volumes |
Two details deserve attention. Prevention fell from 69% to 62% in one year and then recovered, which shows that control effectiveness is not a fixed property of a product. Configuration changes, new software versions, and shifting attacker behavior all move it, and an organization that tested once has no way of knowing which direction its own numbers went. The financial services segment inside the same dataset recorded prevention of 67%, down from 76% the year before, with 65% of simulated attacks logged and 16% alerted. A sector that spends heavily on security still showed a wide distance between logging and alerting.
Why Security Spend Needs Evidence in 2026
Several pressures are converging on Indian security budgets at the same time. Spending is rising by double digits, which draws scrutiny from finance teams who want a link between rupees spent and risk reduced. Gartner's commentary on the India forecast notes that the DPDP Act, together with emerging AI regulation, is adding compliance complexity and accountability pressure on CISOs. Section 8(5) of the DPDP Act, which takes effect in May 2027, requires data fiduciaries to implement reasonable security safeguards. Rule 6 of the DPDP Rules 2025, which commences on the same date, sets minimum measures for those safeguards, including logs, monitoring, and review that allow unauthorised access to be detected and investigated. A safeguard that has never been tested is difficult to describe as reasonable when something goes wrong.
Sector regulators point the same way. SEBI's Cybersecurity and Cyber Resilience Framework sets fixed remediation windows and requires adversary simulation for its higher tiers, and the RBI (Commercial Banks – Cybersecurity, Technology: Risk, Resilience and Assurance Framework) Directions, 2026 carry their own testing cadences for commercial banks. All of these assume an organization can show that controls were checked, gaps were found, and fixes were verified. A dated simulation report that shows a control failing in March and passing in April after a configuration change is exactly the artifact that assumption calls for.
Where BAS Fits Inside Exposure Management
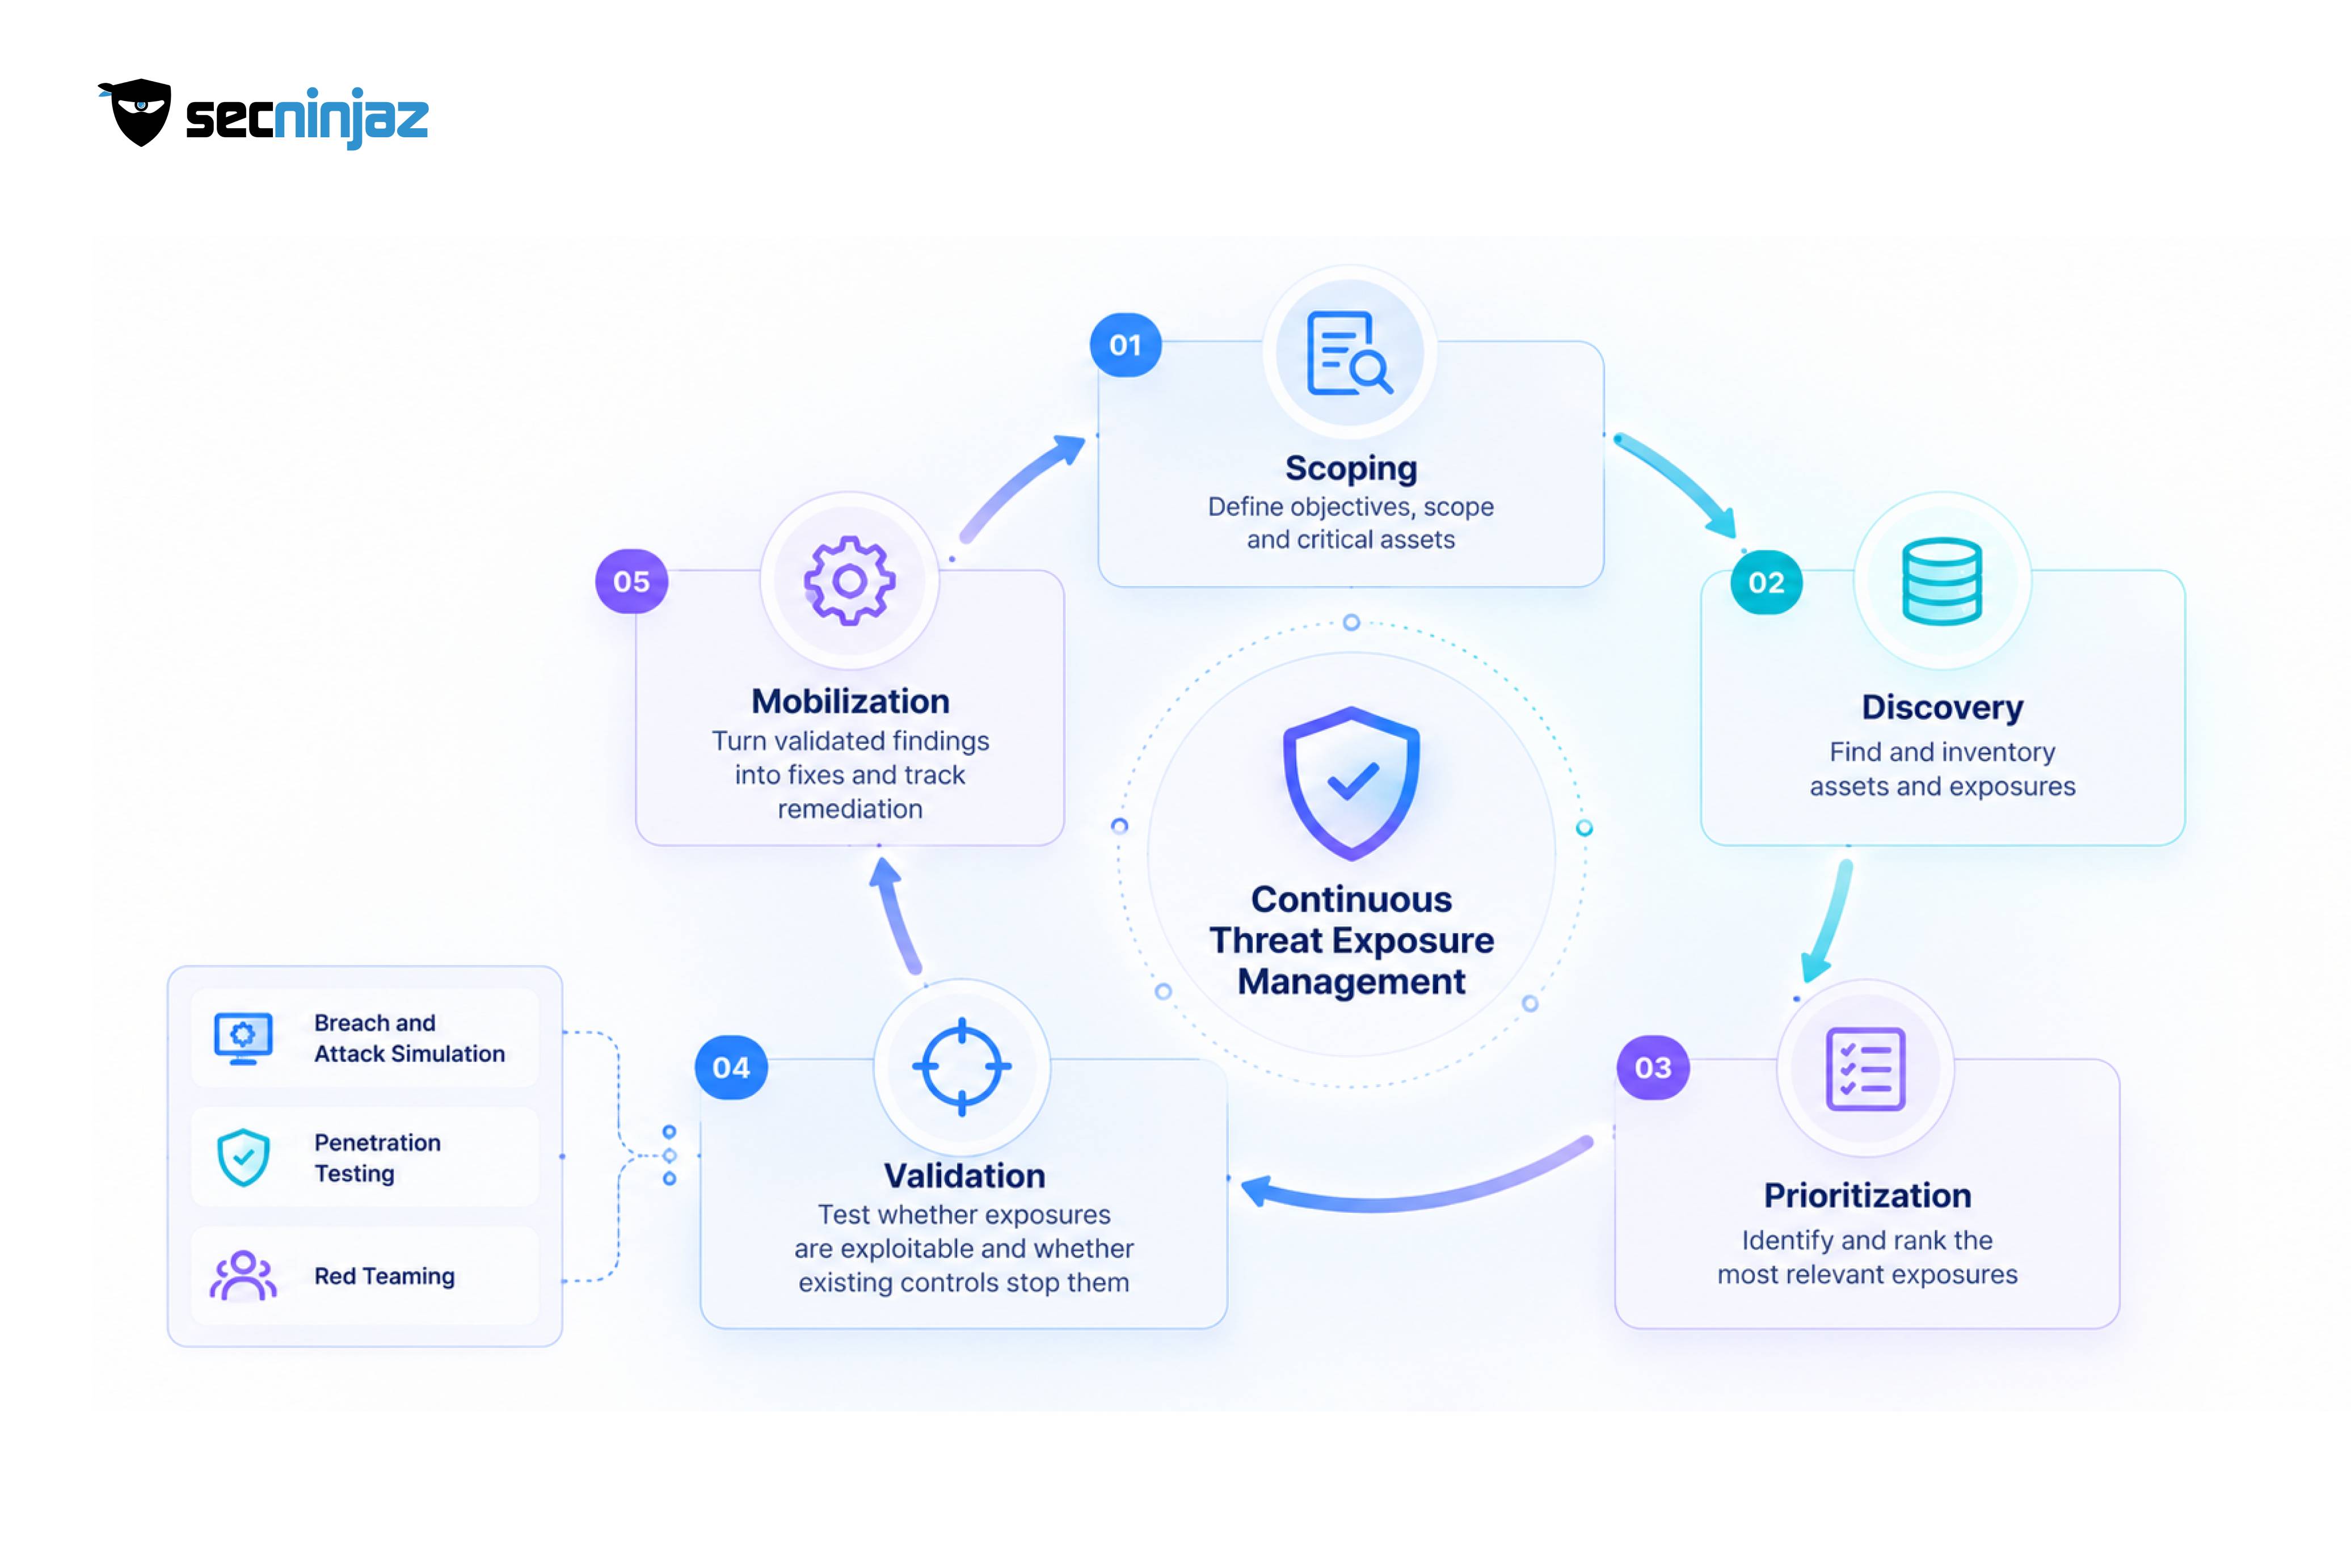
Gartner introduced Continuous Threat Exposure Management, known as CTEM, in 2022 as a five-stage cycle: scoping, discovery, prioritization, validation, and mobilization. Vulnerability scanners and asset inventories feed the discovery and prioritization stages. Validation is the stage that tests whether prioritized exposures are exploitable in practice and whether existing controls would stop an attacker, and BAS, penetration testing, and red teaming all serve it. Mobilization then turns validated findings into fixes. Gartner now groups BAS under a category it calls Adversarial Exposure Validation (AEV), which also covers automated penetration testing and red teaming tools.
Gartner predicted in 2023 that organizations prioritizing security investments through a CTEM programme would see a two-thirds reduction in breaches by 2026. That is a forecast, not a measured outcome, and no independent verification has been published, so it should be read as direction rather than a promise. The underlying logic is sound regardless: spending directed by tested evidence about what actually fails tends to land on better targets than spending directed by vendor roadmaps or last year's budget.
How a BAS Engagement Runs
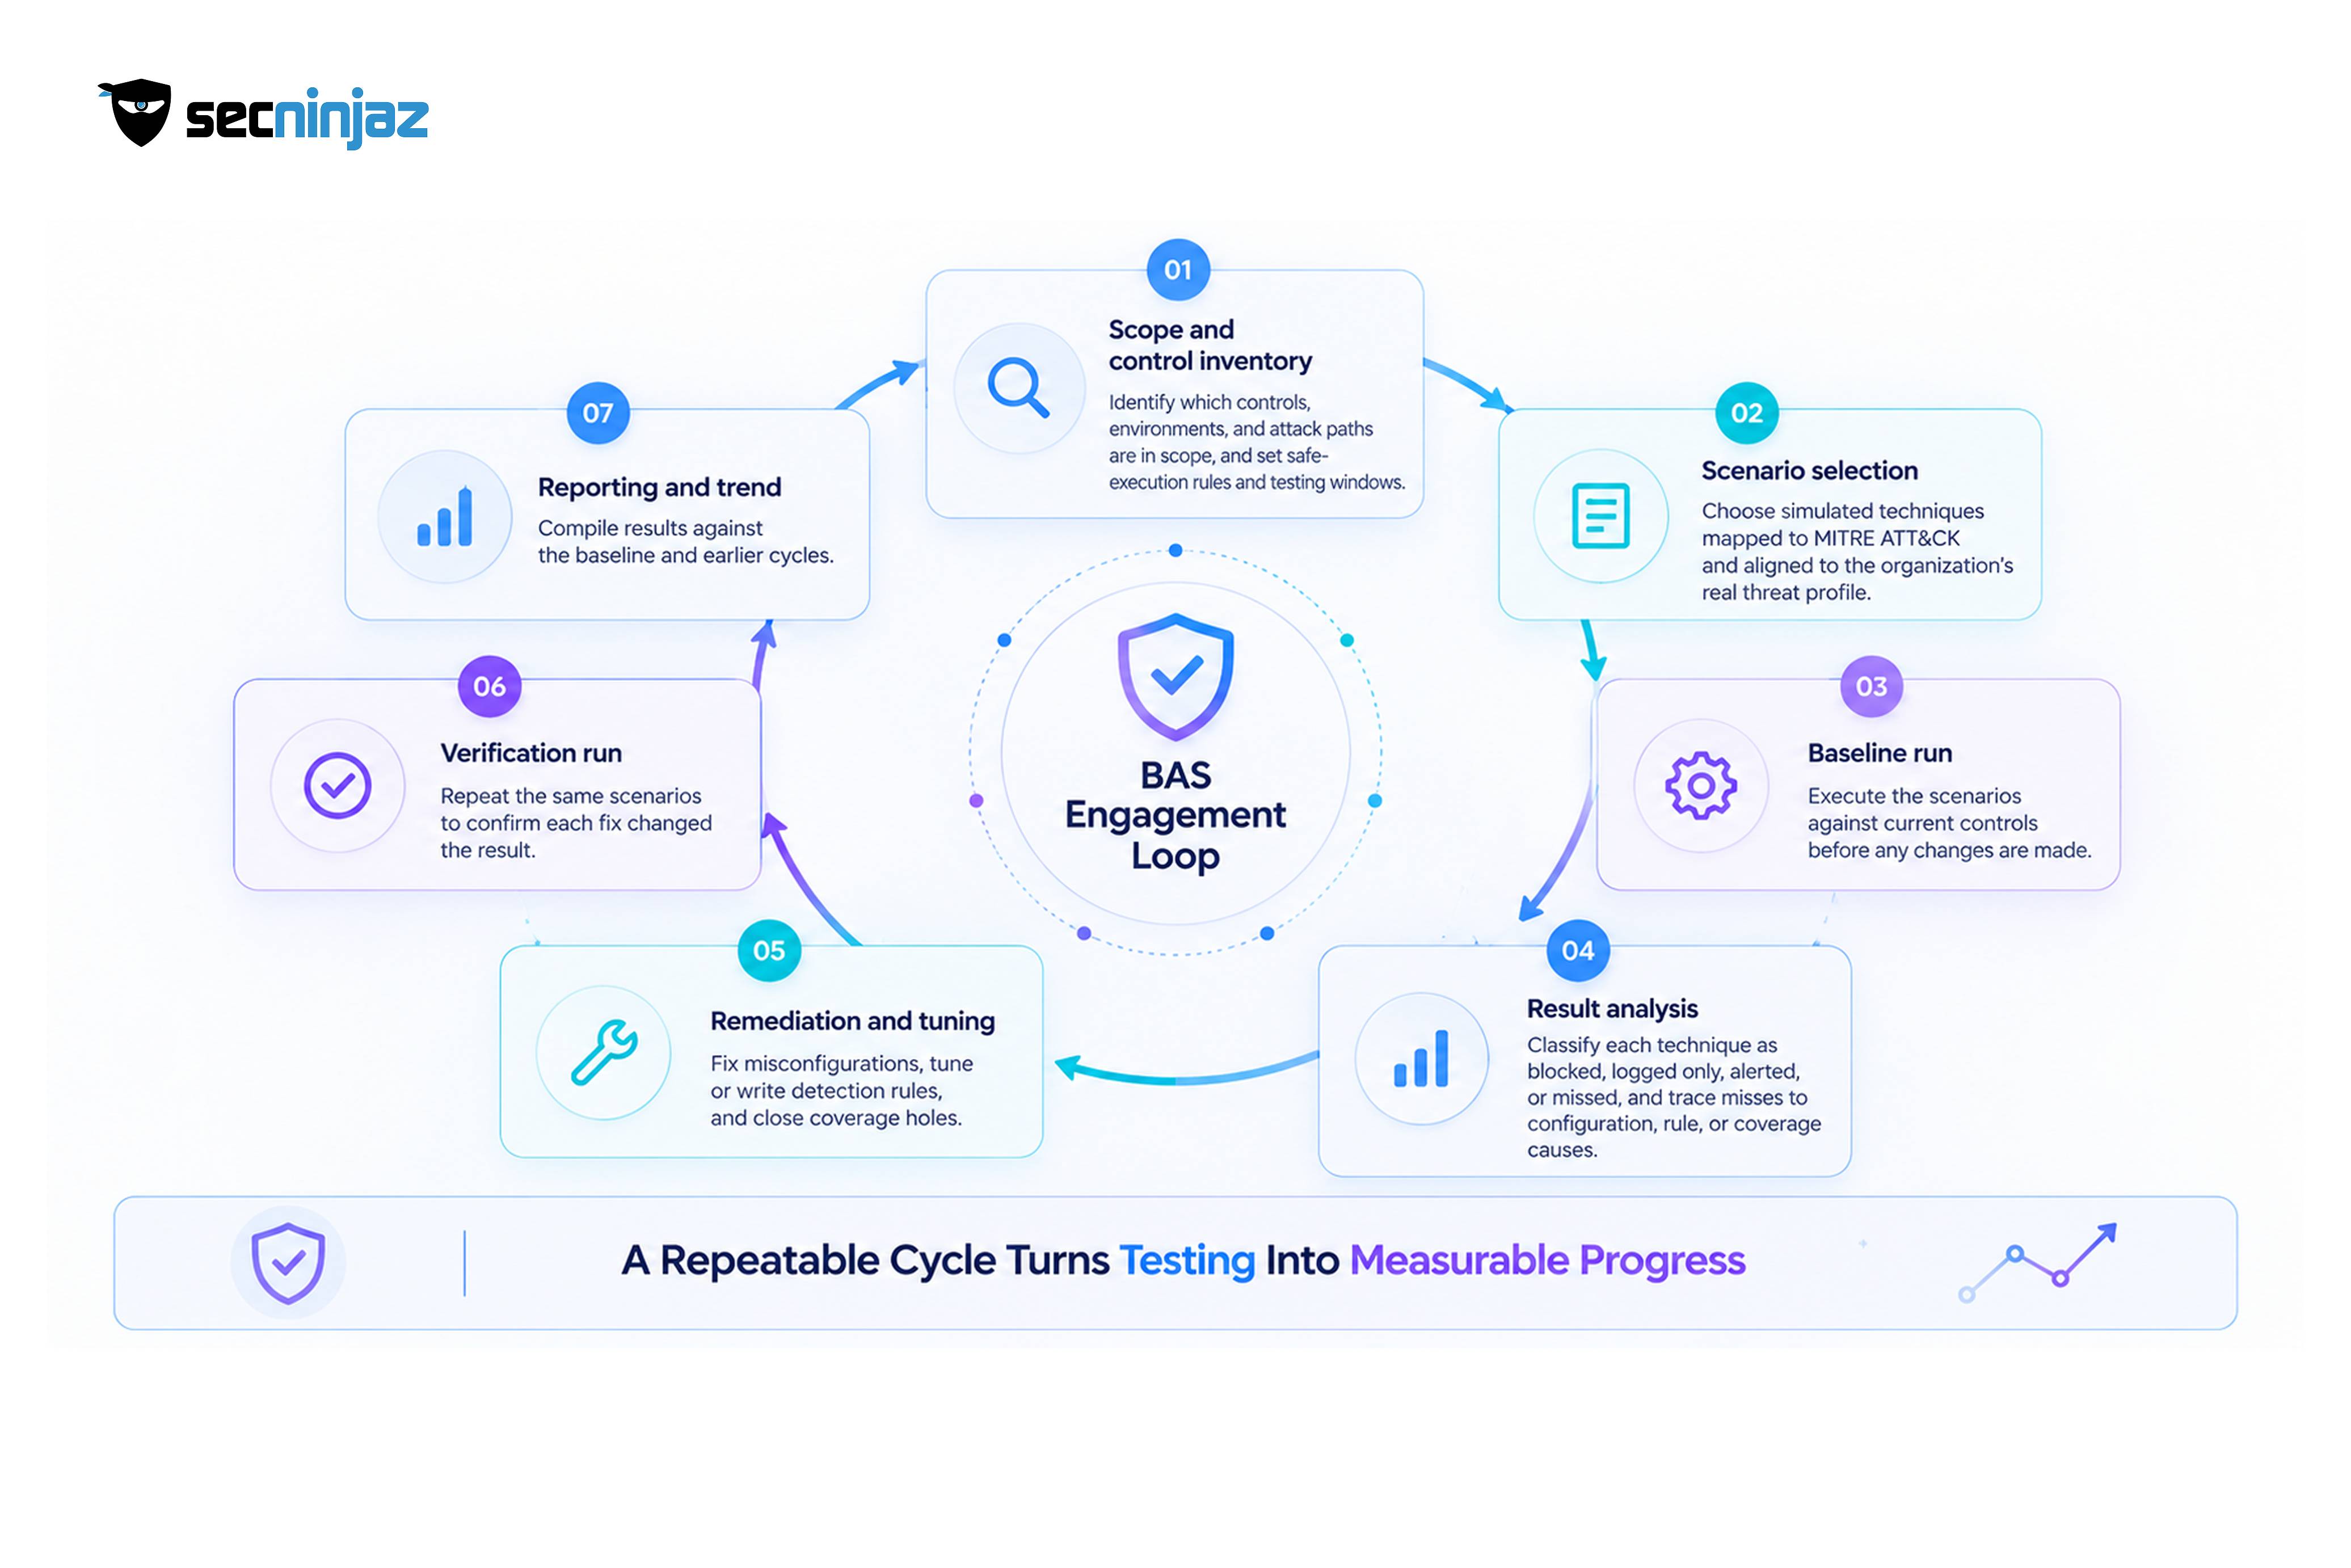
| Step | What happens | What it produces |
|---|---|---|
| 1. Scope and control inventory | Identify which controls, environments, and attack paths are in scope, and agree safe-execution rules and testing windows | A control inventory and a signed-off scope |
| 2. Scenario selection | Choose simulated techniques mapped to MITRE ATT&CK and aligned to threat activity relevant to the sector | A scenario library tied to the organization's real threat profile |
| 3. Baseline run | Execute the scenarios against current controls before any change is made | A starting measurement for each control |
| 4. Result analysis | Classify each technique as blocked, logged only, alerted, or missed, and trace misses to configuration, rule, or coverage causes | A ranked list of control gaps |
| 5. Remediation and tuning | Fix misconfigurations, tune or write detection rules, and close coverage holes | Specific changes owned by named teams |
| 6. Verification run | Repeat the same scenarios to confirm each fix changed the result | Proof that a gap closed, not an assumption that it did |
| 7. Reporting and trend | Compile results against the baseline and earlier cycles | Evidence that can be shown to leadership, auditors, and regulators |
The sixth step is where BAS earns its place in a budget conversation. A fix that was never retested remains a hypothesis, and a before-and-after pair of results is the closest a security team can come to showing that a specific piece of work changed the organization's exposure.
Turning Results into Evidence
Raw simulation output is a technical record. Evidence is the same data arranged for the people who have to rely on it.
| Evidence element | Primary audience | How it is used |
|---|---|---|
| Control-by-control block, log, and alert rates | Security leadership | Identifies which tools underperform and which overlap |
| MITRE ATT&CK coverage map | SOC and detection engineering | Shows which techniques have no detection at all |
| Before-and-after results for each remediation | Audit and compliance | Demonstrates that a reported fix was verified |
| Trend across simulation cycles | CFO and board | Shows whether effectiveness is improving, flat, or drifting |
| Mapping to ISO 27001, SEBI CSCRF, RBI, and DPDP safeguards | Regulators and external auditors | Links tested control behavior to specific obligations |
Return on security investment is difficult to express as a single figure, and any programme that promises one should be treated with suspicion. BAS supports the argument through three narrower routes. It shows which tools block what they were bought to block, which supports renewal decisions. It reveals overlap between products, which supports consolidation. And it shows where gaps remain, which supports directing new budget toward measured weaknesses rather than toward whatever category is currently fashionable.
What Unvalidated Security Spend Costs
| Gap | Consequence |
|---|---|
| Controls deployed but never tested against attacker techniques | Shelfware and false assurance, with no way to tell a working control from a silent one |
| Detection rules never verified end to end | Events are logged but never alerted, the pattern behind the 58% logging against 14% alerting gap |
| Configuration changes made without a re-test | Prevention drifts downward unnoticed, as the one-year slide from 69% to 62% showed |
| Budget requests built on tool counts rather than test results | Requests are cut or approved without any link to risk reduction |
| No dated evidence of tested safeguards | Difficulty demonstrating reasonable security safeguards to an auditor, a regulator, or the Data Protection Board |
A Maturity Model for Security Control Validation
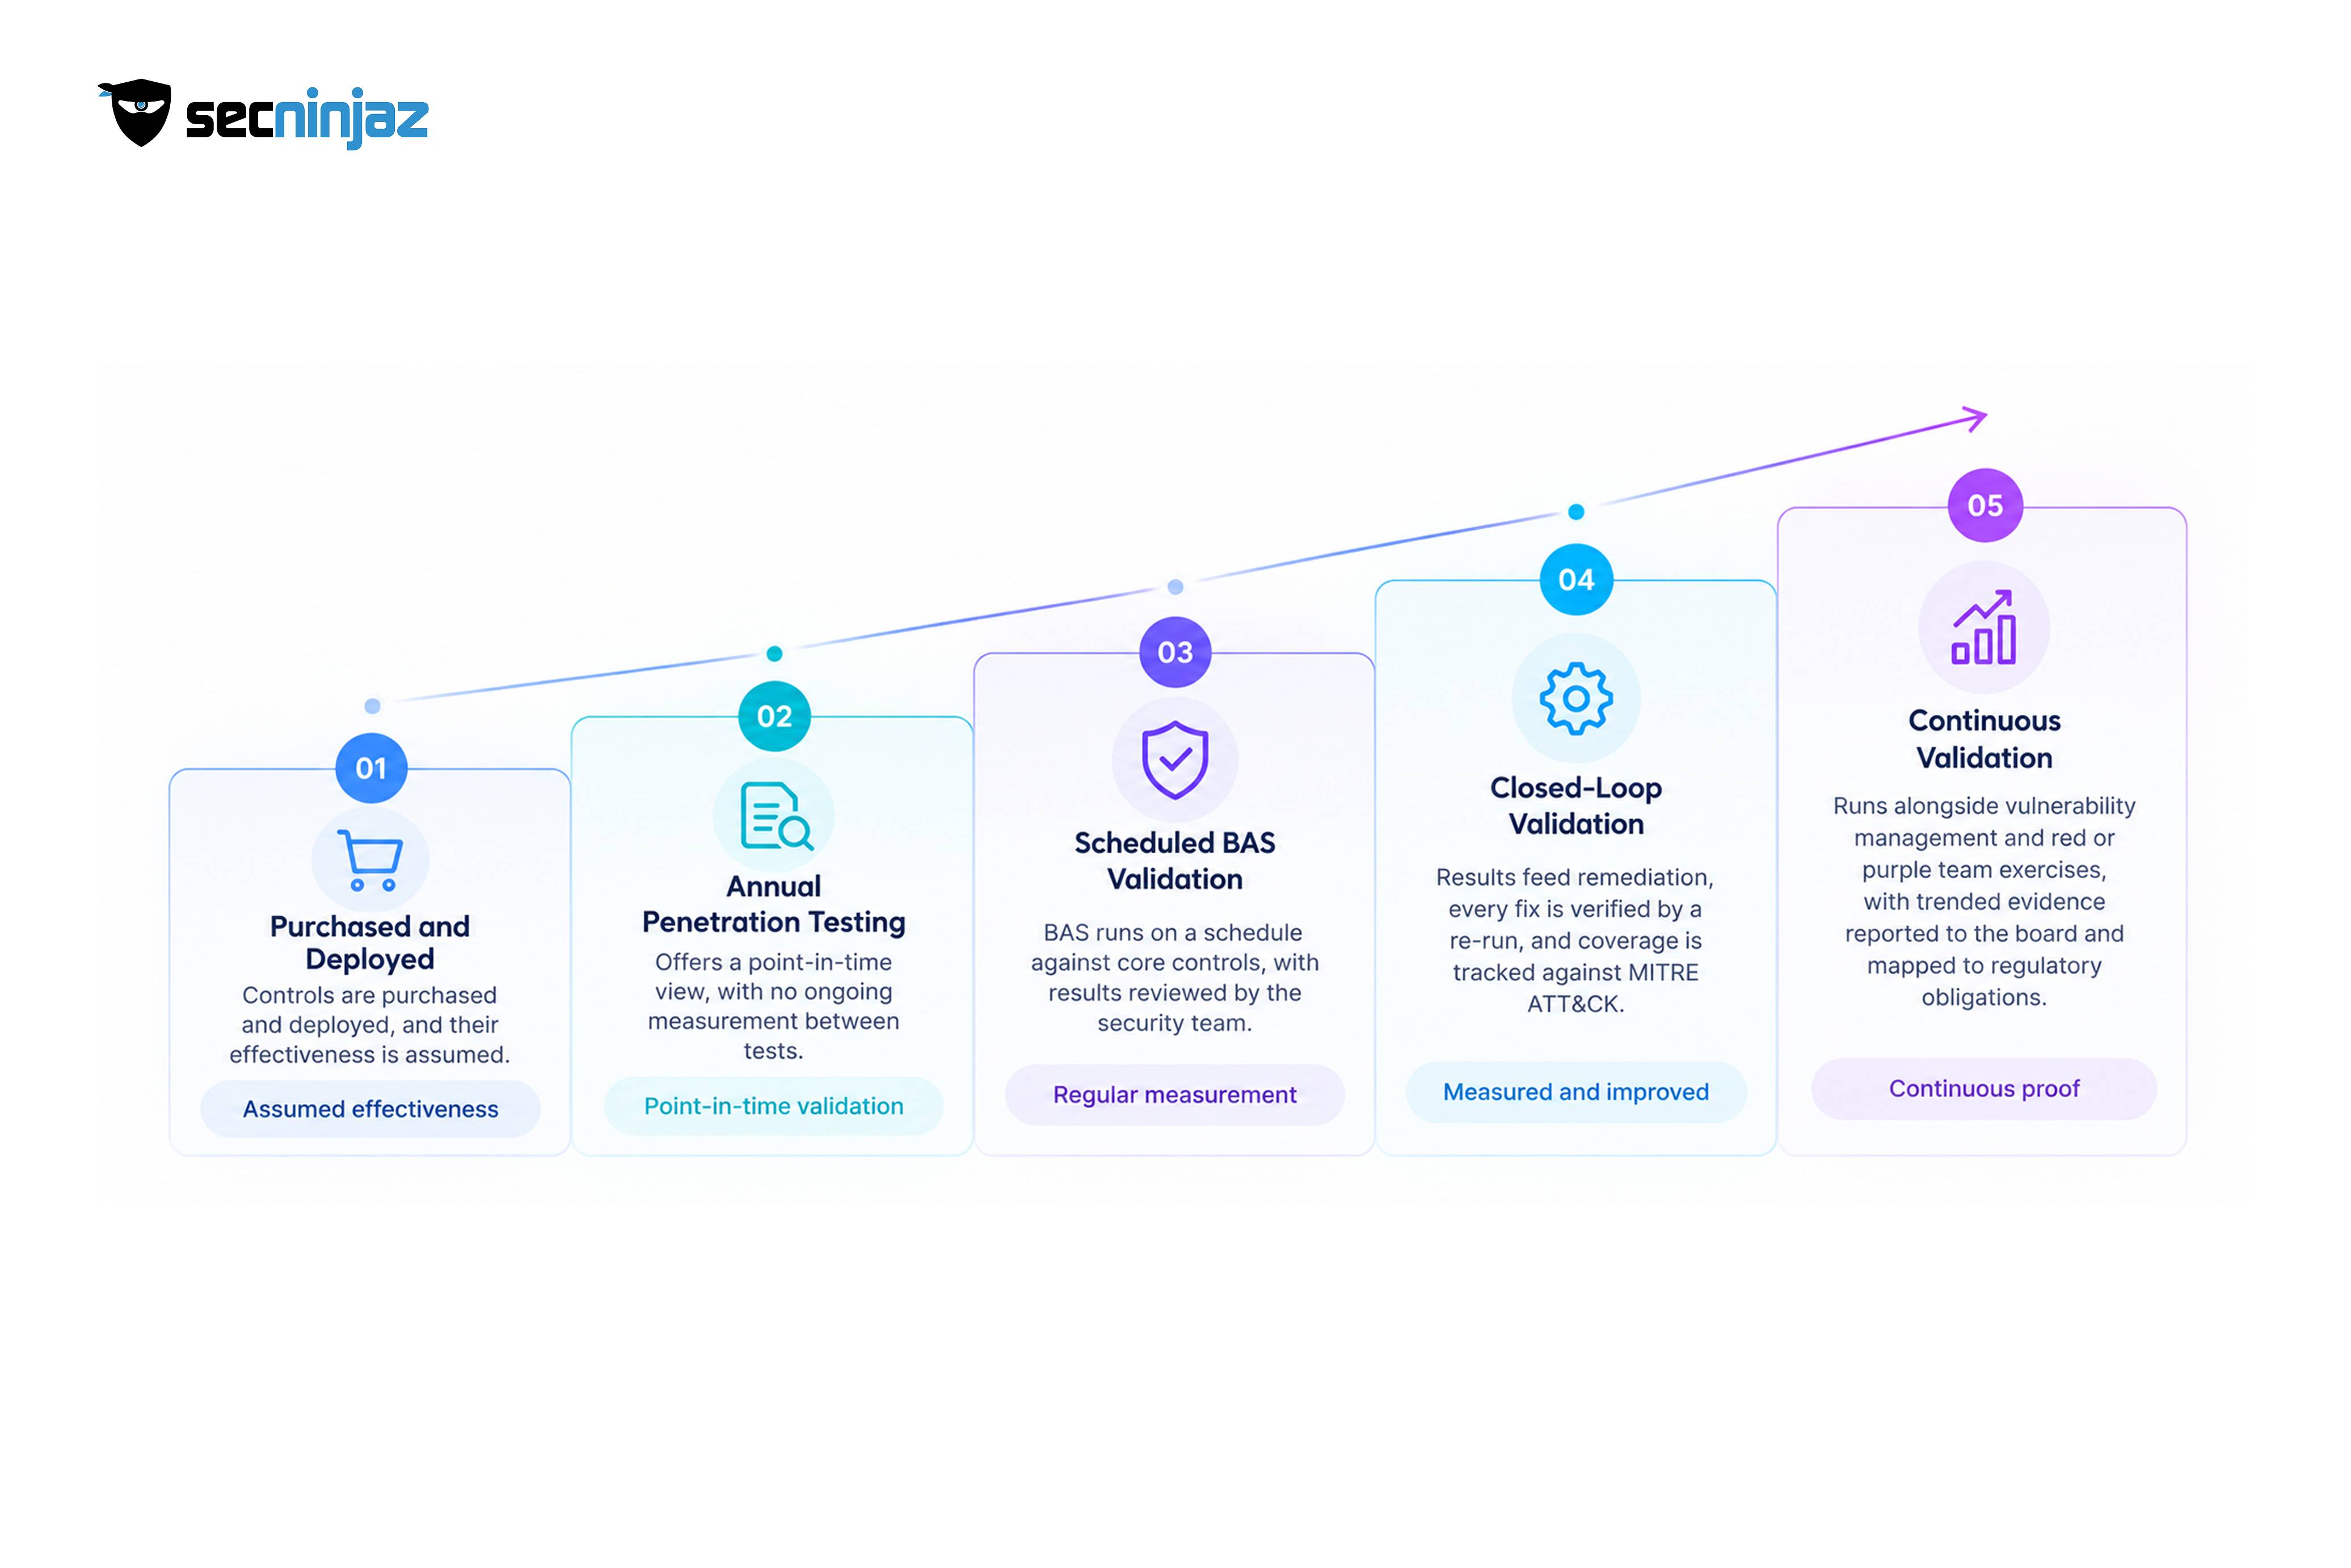
Most organizations sit somewhere on a five-level path between assumed effectiveness and continuous proof.
Level 1: Controls are purchased and deployed, and their effectiveness is assumed ↓ Level 2: Annual penetration testing offers a point-in-time view, with no ongoing measurement between tests ↓ Level 3: BAS runs on a schedule against core controls, with results reviewed by the security team ↓ Level 4: Results feed remediation, every fix is verified by a re-run, and coverage is tracked against MITRE ATT&CK ↓ Level 5: Continuous validation runs alongside vulnerability management and red or purple team exercises, with trended evidence reported to the board and mapped to regulatory obligations
The move from Level 2 to Level 3 is the largest practical step, since it replaces a yearly snapshot with a measurement cycle short enough to catch drift while it is still cheap to correct.
A Readiness Playbook for a BAS Programme
- Inventory the controls in scope before choosing scenarios. A simulation can only test what has been identified, and an incomplete inventory produces an incomplete picture.
- Agree safe-execution rules and testing windows in writing. Production use depends on clear boundaries, rollback arrangements, and a named contact for the operations team.
- Select scenarios from threat activity relevant to the sector. A generic library wastes effort on techniques the organization is unlikely to face.
- Run a baseline before changing anything. Without a starting point, later improvement cannot be shown.
- Classify every result as blocked, logged, alerted, or missed. The distinction between the middle two is where most detection gaps hide.
- Assign each gap to a named owner with a due date. Findings without owners tend to reappear in the next cycle.
- Re-run the same scenarios after every fix. A verified result is the evidence; the ticket closure is not.
- Report trends to leadership on a fixed rhythm, and revisit the scenario library as attacker behavior and the control stack both change.
Common Mistakes and Edge Cases
Treating a high prevention score as proof of safety. A 69% average still means roughly a third of simulated actions passed, and the post-compromise figure was far lower.
Counting logged events as detection. Logging and alerting are separate outcomes, and the distance between them is often the largest gap in a SOC.
Running simulations once and filing the report. Controls drift with every configuration change and software update, so a single run ages quickly.
Skipping the verification run. Without a re-test, the report shows what was found but cannot show what was fixed.
Choosing scenarios for coverage volume rather than relevance. A very large scenario count looks thorough but dilutes attention from the techniques that matter most to the sector.
Treating BAS as a substitute for penetration testing or red teaming. Automated simulation of known techniques does not replace a human tester's creativity or a red team's test of judgment under pressure.
When to Use What: A Few Decision Points
BAS versus penetration testing. Choose BAS when the question is whether deployed controls keep working over time. Choose penetration testing when the question is whether a skilled attacker could chain weaknesses into a real compromise. Most mature programmes run both.
Continuous simulation versus quarterly runs. A fast-changing environment, frequent releases, or a regulatory regime with short remediation windows favors continuous or weekly runs. A stable estate with limited change can reasonably begin quarterly and tighten the cadence once the first results show how quickly controls drift.
Production testing versus a staging environment. Production gives the most accurate result and carries the most operational risk, so it needs the strictest safe-execution rules. A staging environment reduces risk but can hide gaps that only appear against real traffic and real configuration.
An in-house platform versus a managed service. An organization with detection engineers who can act on results every week can run the tooling itself. One without that capacity gains more from a managed service that handles scenario selection, analysis, and verification alongside the remediation guidance.
How SecNinjaz Fits Into This
Breach and Attack Simulation sits within SecNinjaz's Cybersecurity practice alongside Vulnerability Assessment, Penetration Testing, Red Teaming, Purple Teaming, and AI SOC Automation. That arrangement lets simulation results flow directly into the next step, whether it is a purple team exercise that fixes a detection gap collaboratively, a penetration test that probes a path the simulation flagged, or detection tuning inside a continuously monitored SOC.
The evidence side connects to SecNinjaz's GRC and DPDP practice, including Audit and Gap Assessment and Regulatory Compliance, which map tested control behavior to ISO 27001, SEBI CSCRF, RBI, and DPDP safeguard obligations. SecNinjaz holds ISO/IEC 27001:2022 certification, relevant because simulation results describe exactly where an organization's defenses fail, and that material needs the access control and confidentiality discipline the standard requires. For organizations that need to show a board or an auditor what their security spend actually delivers, that combination of continuous validation and compliance mapping is the pairing worth looking for, whether the organization works with SecNinjaz or anyone else.
Talk to Our Security Experts →
Frequently Asked Questions
What is breach and attack simulation?
Breach and attack simulation is automated security testing that safely executes real attacker techniques against an organization's live controls and records whether each technique was blocked, logged, or alerted on. It measures whether deployed tools are doing their job, and the same scenarios can be repeated to track change over time.
How is BAS different from penetration testing?
Penetration testing uses human testers to exploit weaknesses and chain them into a realistic compromise, usually once or twice a year. BAS automates known attacker techniques against deployed controls and can run weekly or continuously, answering whether those controls still work rather than whether a creative attacker could find a way around them. The two methods address different questions and complement each other.
Is it safe to run attack simulations in a production environment?
BAS scenarios are designed to emulate attacker behavior without causing damage, which is what makes production use practical. Safe execution still depends on agreed scope, testing windows, rollback arrangements, and a named operations contact, and organizations new to the practice often begin with a staging environment before moving to production.
What does the gap between logging and alerting mean?
Logging records that an event happened, while alerting brings it to an analyst's attention. The Picus Blue Report 2026 found 58% of all simulated actions logged in a SIEM but only 14% producing an alert, which points to detection rules that are missing, mistuned, or failing under load. Closing that gap is usually a detection engineering task rather than a tooling purchase.
How does BAS help justify cybersecurity spending?
BAS shows which tools block what they were bought to block, which products overlap, and where measured gaps remain. That supports renewal, consolidation, and budget allocation decisions with dated test results instead of tool counts. It does not produce a single return-on-investment figure, and claims of one should be treated carefully.
Where does BAS fit in Gartner's CTEM framework?
CTEM runs through five stages: scoping, discovery, prioritization, validation, and mobilization. BAS belongs to the validation stage, alongside penetration testing and red teaming, where it tests whether prioritized exposures are exploitable in practice and whether existing controls would stop an attacker.
How can BAS results support DPDP Act and regulatory compliance?
Section 8(5) of the DPDP Act, which takes effect in May 2027, requires reasonable security safeguards, and Rule 6 of the DPDP Rules 2025 sets minimum measures that include logging, monitoring, and review. Sector frameworks such as SEBI's CSCRF expect verified remediation. Dated simulation reports showing a control failing, being fixed, and passing a re-test provide concrete evidence that safeguards were tested. They support a compliance case but do not by themselves satisfy any legal obligation.
Where should an organization start with breach and attack simulation?
Start with an inventory of the controls in scope and a written agreement on safe-execution rules, then run a baseline before changing anything. Classifying each result as blocked, logged, alerted, or missed, assigning an owner to every gap, and re-running the same scenarios after each fix produces the first usable evidence within a single cycle.